The NGVS data pipeline: background subtraction


Summary:
This page describes the global backgroound subtraction method used by NGVS data pipeline. A background map is built up from images from each observing run. This map is scaled to the appropriate sky level and the subtracted from the NGVS images. When possible, this method is replaced with the Elixir-LSB method.
The background problem:

NGVS processing is mostly simliar to normal MegaPipe processing. There is, however, an additional complication due to the presence of bright extended objects in Virgo, such as M87. These objects preclude the normal method of subtracting the sky background of the images before stacking. Normally, SWarp measures the background by taking the mode of the image pixel values over a certain area. Although the area can be tweaked, typically it is a 256x256 or 512x512 box. This procedure works well if the majority of the image pixels do not contain flux from sources. However, in the case of M87, which covers most of the MegaCam mosaic, this is not the case. All the pixels will contain some flux from the galaxy. Subtracting this flux will essentially remove the galaxy. In some cases, this is useful, so background subtraction has been done in this method. The images are marked "l128" for "local background subtraction, 128 pixel grid".

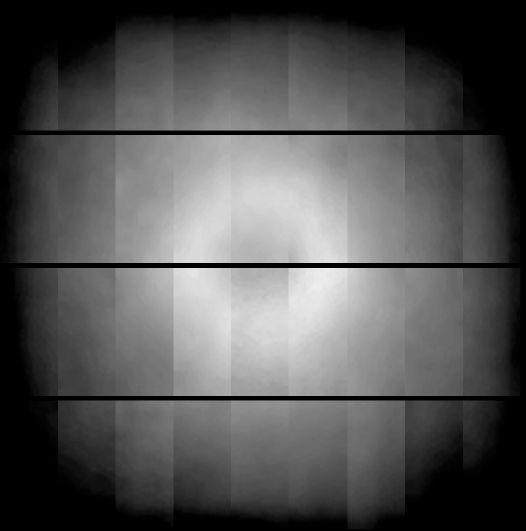
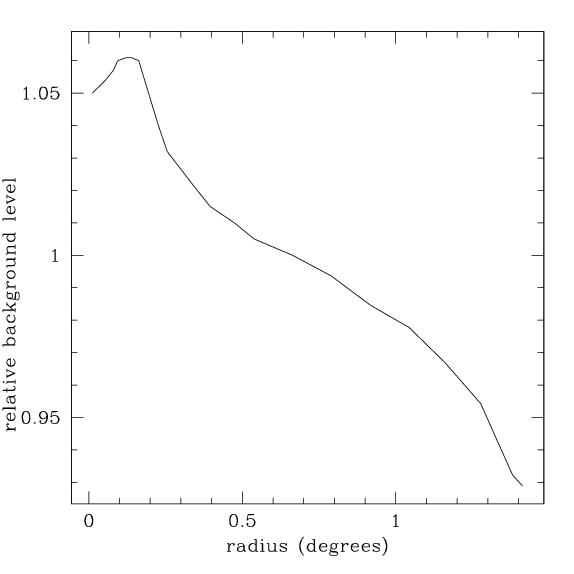
The problem is compounded by the fact that, in the usual Elixir pipeline processed images, the background level varies accross the mosaic in a systematic manner. The background near the centre of the image is approximately 10% higher than at the corners, with a slight dip at the very centre. This is shown in the following two figures:

The image at right an example of the sky background. The edges are darker, the centre is brighter, with a slight crater in the middle. There are also more subtle variations from chip to chip and within each chip. The background is fairly radially symmetric but not completely. background map
The figure at right shows a slice from centre to corner of the background variation. The relative background level varies by more than 10% from edge to centre. Near the centre, the variation is 5% over 0.4 of a degree. Note that this scale is the on the same order (or slightly smaller than) the scale of the largest galaxies in Virgo. Radio profile of background
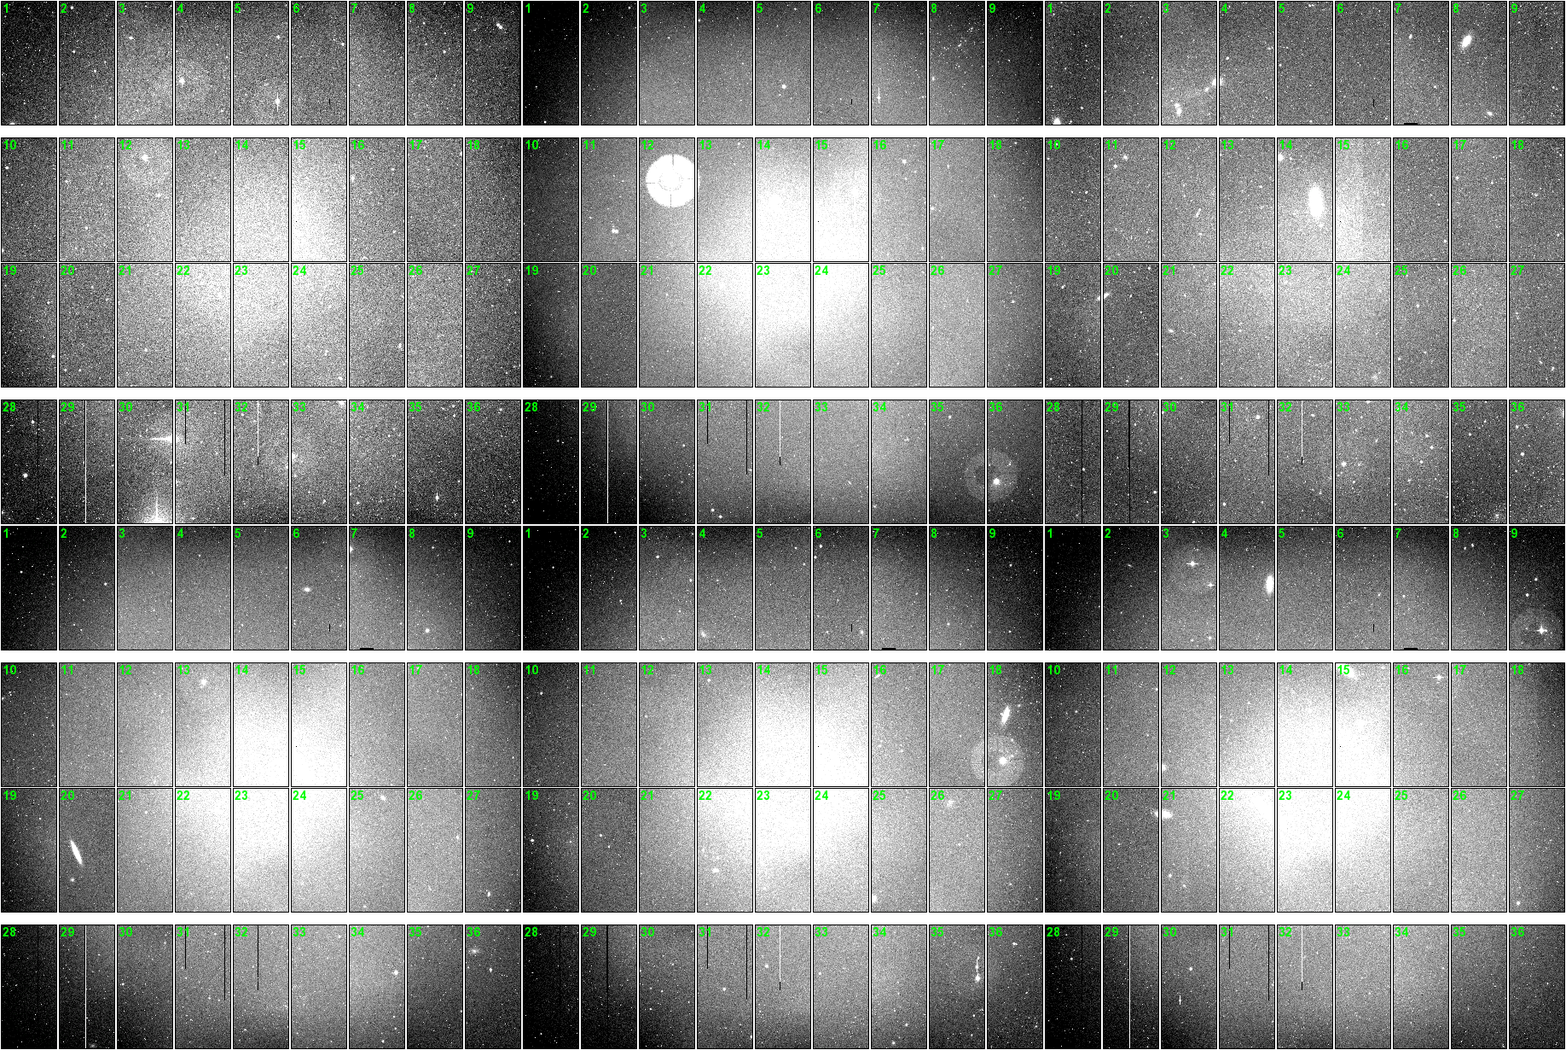
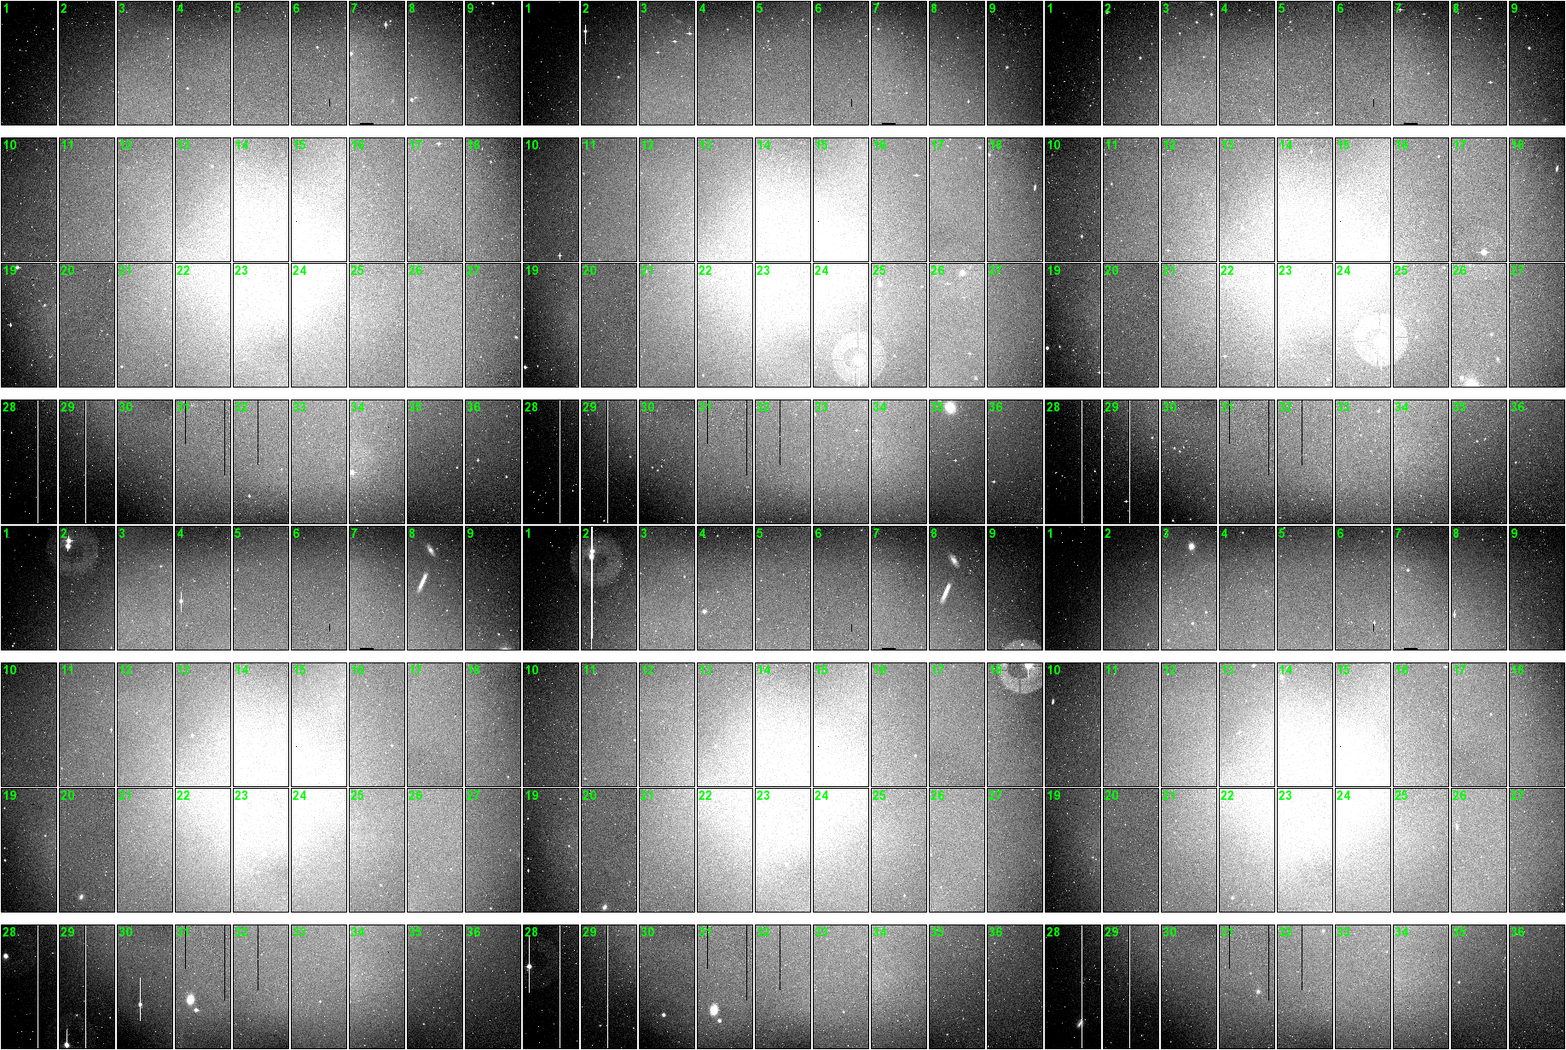
The background varies with time. The animated gif at right shows images taken in the z-band over several runs from 2008 to 2012. The greyscale range of each image is set to +/- 10% of the median of the image; thus despite the changes in background level, the spatial variations of the background are on the same scale. While the general charateristics of the background pattern remain consistent from run to run, there are notable variations from image to image. Run-to-run variation of the background


Within a single run, the background varies slightly from exposure to exposure, but not nearly as much. The animated gif at right shows images taken during CRUNID=10AM04. There some variations, but to a far lesser degree. Exposure-to-exposure variation of the background
Rejected methods:
  • Single value back ground subtraction: Based on the figure above, this will leave 5% variation in the background.
  • Local background subtraction: In this method, one measures the background on a grid and then interpolates between the grid points (using bi-linear interpolation or a spline of some sort) to determine the background at each pixel. The problem with this method is that if the grid is small, it will remove the large galaxies, and if it is large, then it will not remove all the background variations. Since the background variations are smaller than the galaxies, there is no optimal scale.
  • Local background subtraction with masking: This is similar to method 2, but the areas containing large galaxies are masked, and not included in the background grid calculation. In this case, one is essentially interpolating across the masked parts of the images. If the masked parts are large, then this method becomes very similar to method 1. If the masked parts are small, this method becomes very similar to method 2. As mentioned before, since the background varies on a smaller scale then the galaxies, there is no optimal size.
  • At the beginning of the NGVS project, a single background map per filter was built. This background map was scaled to each image and subtracted. These are the "g001" images. While this was adequate in many cases, the run-to-run variations mean that it is not optimal.
Adopted method:

In order to remove the background one must have information as to what the image would look like if the large galaxies weren't there. Thus the best approach is to make a general map of the background variation across the mosaic from data which do not contain bright extended sources. This map can then be scaled to the sky level in areas of the image that are not affected by the bright galaxies and then subtracted. Images prepared in the following way are labelled "g002" for "global background subtraction, version 2".

To create this map, the following procedure is used: For each run and each filter, the CADC archive is searched for available MegaCam images. Images with longer exposure times (>100 seconds) are preferred. Shorter exposure images are only included if no long exposure images are available. Although images taken as part of the NGVS are preferred, all available images are considered. Images are screened by eye. Images with conspicuous oddities in their backgrounds are rejected. This typically includes images taken near twilight and images where the moon has changed the illumination pattern. In addition, images of very extended objects (such as nebulae) and images with stellar densities are rejected. If possible, only one image per pointing is used. Other images of the same pointing are discarded. In some cases, this constraint is not possible, but in any event no more than 20% of the images going into a background map are of the same pointing. At minimum, 10 images are used to build a background map. In some cases more than 40 are images are available.

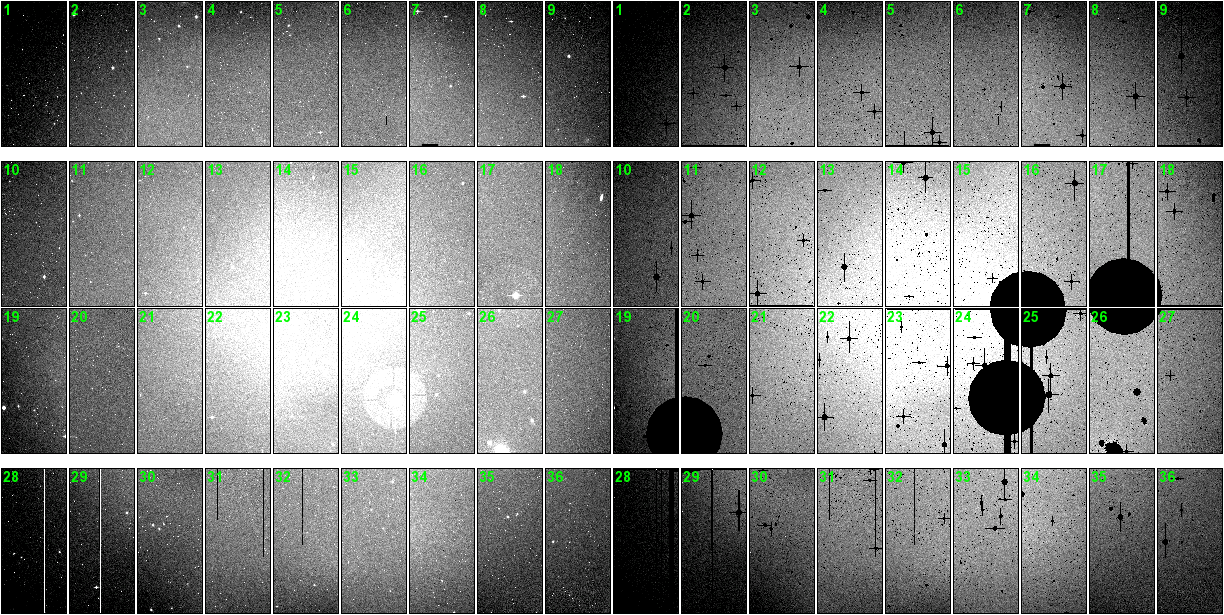
Each image going into the background map is masked. SExtractor is run on the images; the segmentation check image it generates is used to reject pixels containing sources. To remove the halos around bright stars, an area of 3 arc minutes is removed near USNO stars brighter 10th magnitude. The bad CCD pixels and columns are also masked. The animation at right shows an example of the masking. Note that only the core of the bright galaxy in chip 26 is masked. Additional hand masking is required. This is done on a chip by chip basis. Example of masking
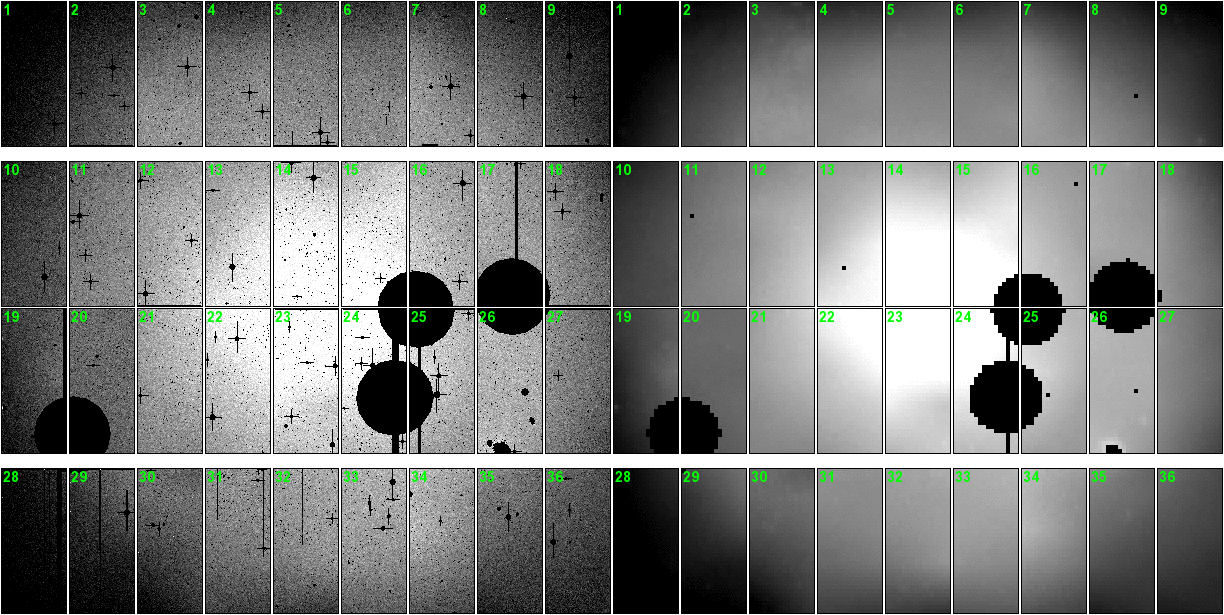
The images are then smoothed and sub-sampled. Medians are generated on 128 pixel centres. The smoothing removes any faint residual light from sources and increases the signal-to-noise of the background measurements. The animation at right illustrates the smoothing. Example of smoothing

Next, these smoothed and sub-sampled images are normalized to unity and combined. The normalization must be done carefully because of the masking. For example, if there are masked chips near the centre of the moasic, which is brighter the normalization factor will be systematically under-estimated. The scaling and combination is done iteratively until the normalization factors stabilize.

The new background map is applied to each of the images that went into it. The map is scaled by the normalization factor and subtracted from the input image. The residuals input image is examined by eye for extended sources which were missed in the initial assesment. These include faint stellar halos and galaxies which are too faint and diffuse for SExtractor to detect. Occasionally, the residuals indicate problems on over the whole mosaic. For example nearby bright stars can produce large, but very faint halos. The bad chips and/or images are rejected and the normalization and combinination step is repeated. The procedure is typically iterated 3-4 times.

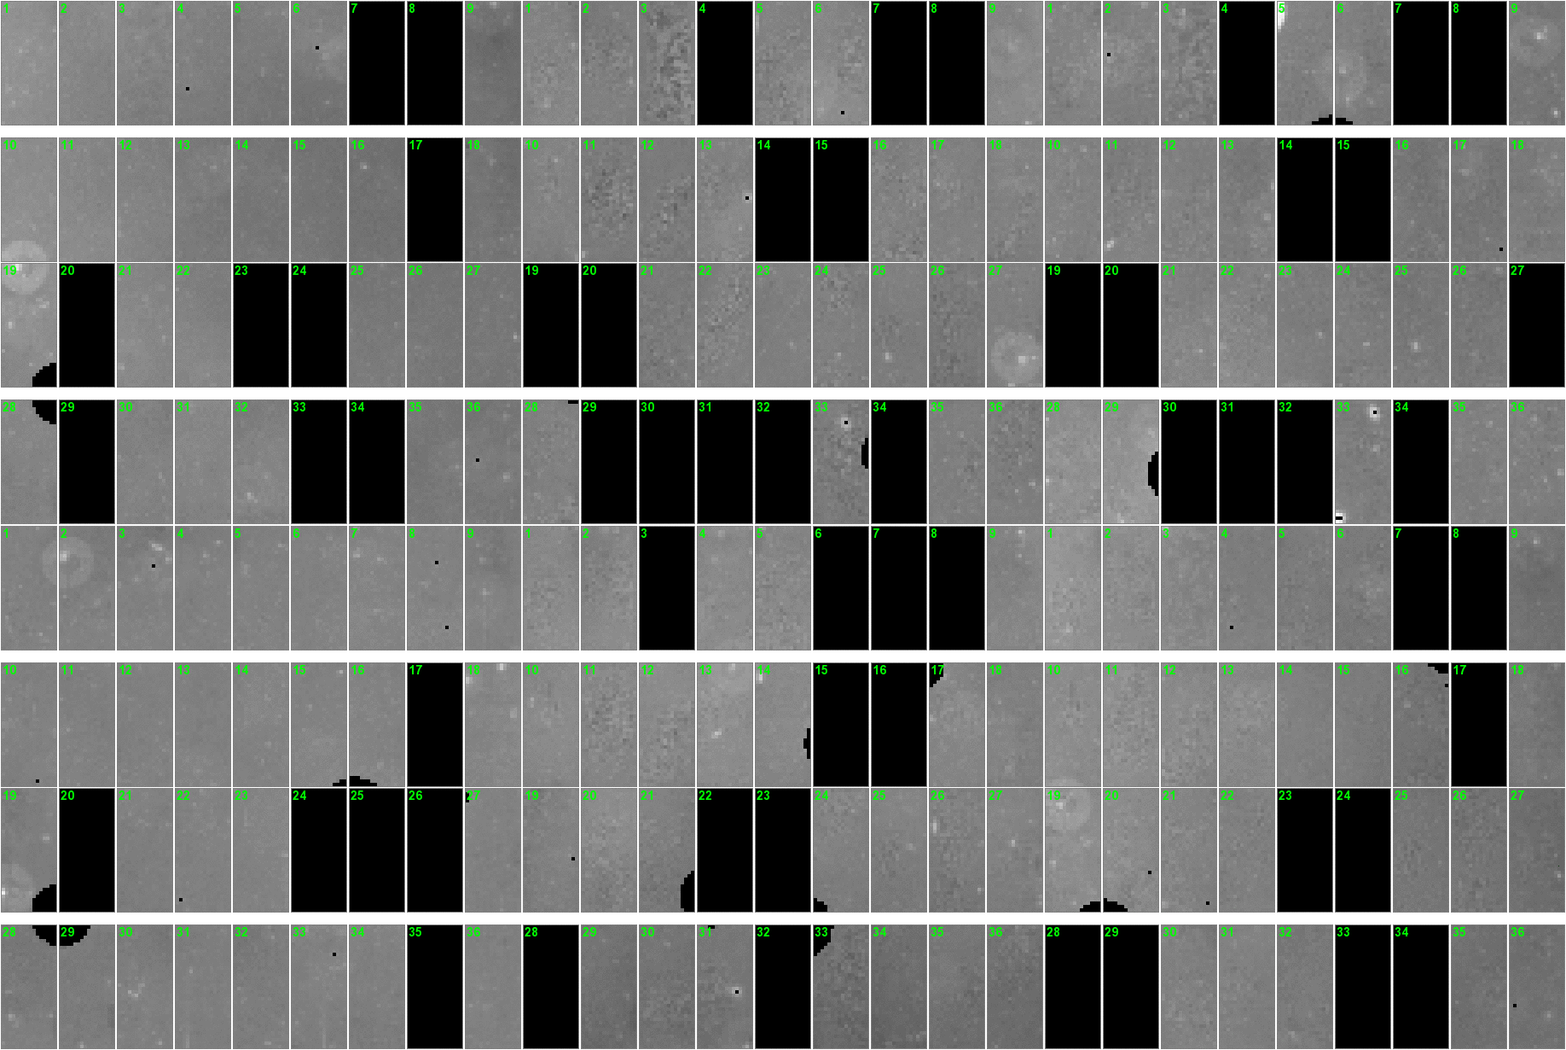
The animation at right shows the residuals of the input images after the background has been removed. The greyscale range is now +/- 1%; this is 10 times the contrast of the animations above. The black chips have been masked. A few unmasked faint stellar haloes and galaxies remain. Residuals
To use this background map, one first masks a science image, removing the bad columns and pixels containing astronomical sources, as was done with the images that went into background map. The background map is carefully normalized to the science image and subtracted. The resulting image has a median sky value of 0.